In research and data science, we sometimes encounter biased data: that is, data that has not been sampled completely randomly and suffers from an over- or under-indexing toward the population of interest. Survey data is an example in this regard. Surveys play an important role in providing measurements on subjective user experience indicators, such as sentiment and opinions, which cannot be measured by other means. But because survey data is collected from a self-selected group of participants, it needs to be analyzed carefully.
Bias in survey data is often the result of survey non-response or when the data collection suffers from sampling bias. A similar issue arises in observational studies when comparing treatment groups, and in any data that suffers from selection bias. Directly inferring insights from data with such biases or training ML models on such data can result in erroneous estimates or underperforming models. Hence, it is important for practitioners to understand if and how data is biased and, when possible, use statistical methods to minimize such biases.
For example, say we invite a random set of adults from a population of interest to participate in a survey we are running to estimate the sentiment towards some brand. If, for example, younger people have a higher propensity to participate in our survey, the proportion of younger people from the survey respondents will be higher than their proportion in the population. If younger people also have stronger affiliation with the brand, a simple average of the survey responses will be a biased estimate of the average sentiment in the population.
The field of survey statistics offers methods for mitigating bias in samples, at least partially, by relying on auxiliary information (a.k.a., “covariates” or “features”). When such information is available for all items in the sample as well as for the population from which it was sampled, it can be used to create weights. Applying the weights to the data allows us to produce less biased estimates or models. In the example above, we may wish to adjust for non-response using not only age but other demographic information such as gender, education, etc. This can be done by weighting the sample to the population using the auxiliary information.
The figure below shows a sample (red) vs. population (blue) distribution representing the age bias described in the brand sentiment estimation example above. This figure was produced on simulated data which we set to be biased on other variables such as gender, education as well.
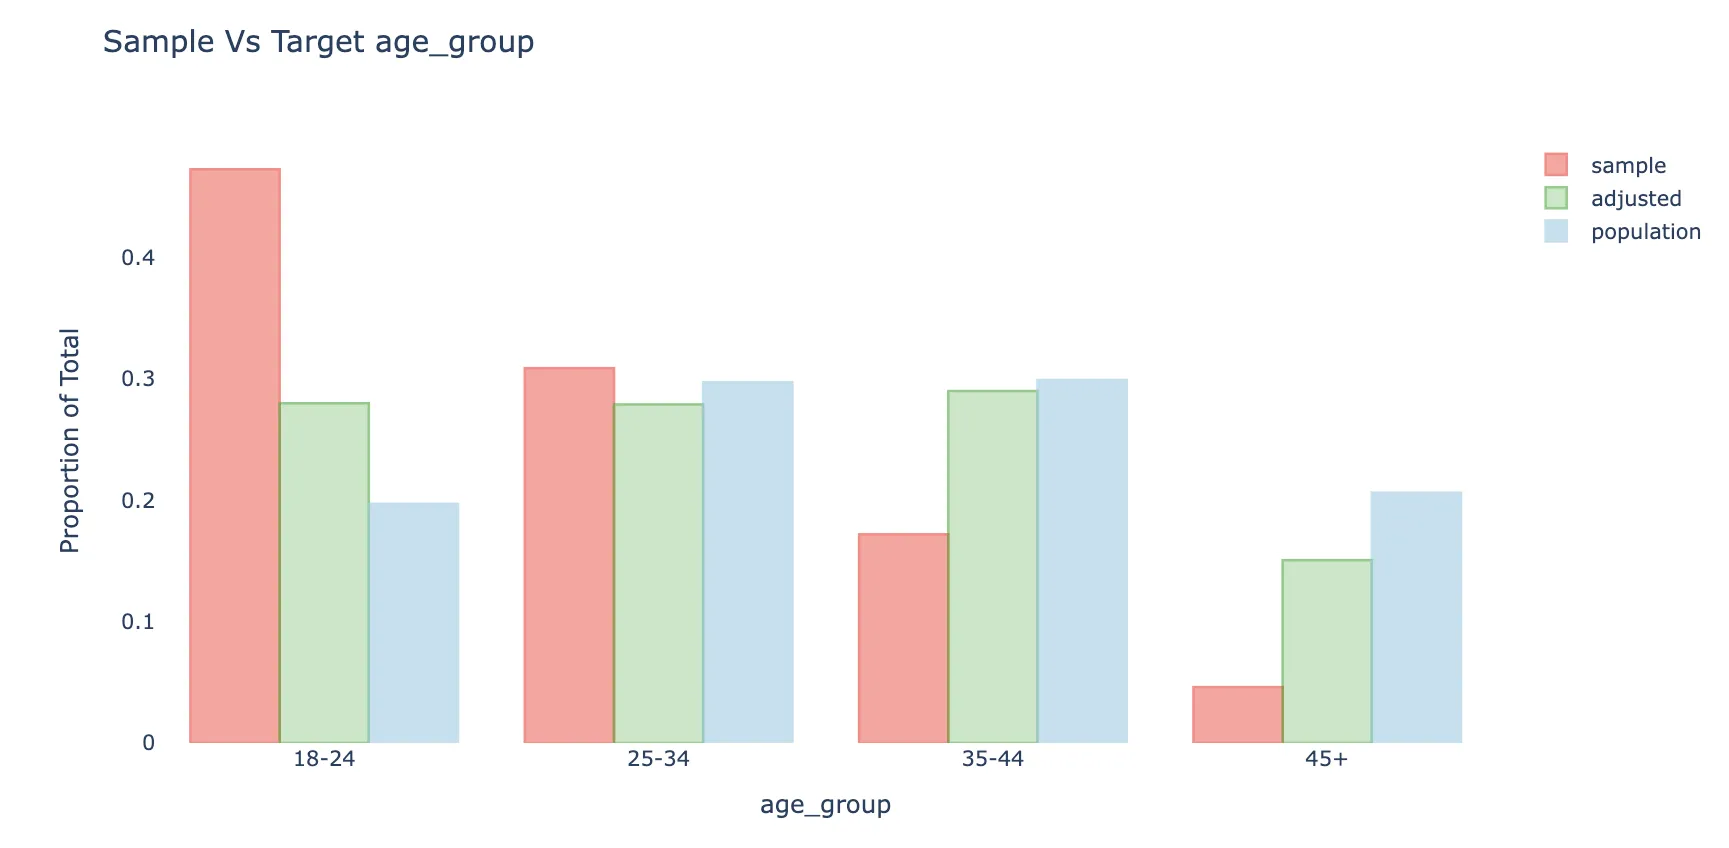
When weights are calculated and applied the weighted sample distribution (green) becomes much closer to the population distribution, and the weighted average will also be less biased to the extent the response is correlated with respondent’s age. Notice the weighted distribution is not fully corrected, mainly because of bias-variance considerations.
balance: a Python package for adjusting biased samples
With survey data playing a key role in research and product work at Meta, we observed a growing need for software tools that make survey statistics methods accessible for researchers and engineers. This has led us to develop “balance”: A Python package for adjusting biased data samples. In balance we introduce a simple easy-to-use framework for weighting data and evaluating its biases with and without adjustments. The package is designed to provide best practices for weights fitting and offers several modeling approaches. The methodology in “balance” already supports ongoing automated survey data processing at Meta, as well as ad-hoc analyses of survey data by dozens of researchers every month.
The main workflow API of balance includes three steps: (1) understanding the initial bias in the data relative to a target we would like to infer, (2) adjusting the data to correct for the bias by producing weights for each unit in the sample based on propensity scores, and (3) evaluating the final bias and the variance inflation after applying the fitted weights. The adjustment step provides several alternatives for the researcher to choose from. Current options include: Inverse propensity weighting of the form of logistic regression model based on LASSO (Least Absolute Shrinkage and Selection Operator [1]), Covariate Balancing Propensity Scores [2], and post-stratification. The focus is on providing a simple to use API, based on Pandas DataFrame structure, that can be used by researchers from a wide spectrum of fields.
We’re releasing “balance” as a Meta Open Source project. We want researchers, data scientists, engineers, and other practitioners to be able to apply these practices when they work in Python, benefiting from Meta’s long research and experience in the field. With relation to “balance” we hope to also create an active community of data science practitioners where people can come together to discuss methodology and build tools that benefit survey-based research across academia and industry. If you work in Python with potentially biased data, we encourage you to use “balance” in your project.
“balance“ website: https://import-balance.org/
github repository: https://github.com/facebookresearch/balance
References
[1] Tibshirani, R. (1996). Regression shrinkage and selection via the lasso. Journal of the Royal Statistical Society: Series B (Methodological), 58(1), 267-288.
[2] Imai, K., & Ratkovic, M. (2014). Covariate balancing propensity score. Journal of the Royal Statistical Society: Series B (Statistical Methodology), 76(1), 243-263.